iNsight by Geir Husdal
In this iNsight we take a closer look at Methane, with a specific focus on Offshore Oil and Gas.
In 2014 Norwegian Environment Agency (NEA) engaged NEMS to improve the knowledge of direct emissions of Methane and NMVOC on the Norwegian Continental Shelf. 68 installations were part of the study.
The outcome resulted in the most comprehensive study of Methane and NMVOC emissions offshore to date. The report covers an updated mapping of sources leading to such emissions.
The first part of the report is in English here.
What is methane?
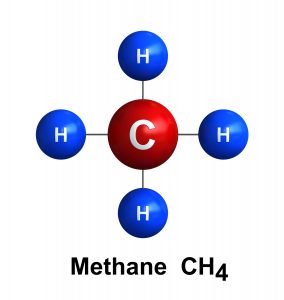
Methane is the simplest and lightest hydrocarbon gas, consisting of one carbon atom and four hydrogen atoms. Methane is a very potent greenhouse gas, with a greenhouse potential 25 times higher than CO2 (in 100 years horizon). Methane is gradually oxidized to CO2 and water vapour in the atmosphere. The greenhouse effect of methane emissions is therefore higher on a short perspective and lower on longer horizons.

Global methane emission and sources
Methane is emitted to the atmosphere through natural geological and biological processes. But there is also a substantial contribution from manmade (anthropogenic) emission. Approximately 2/3 of the global methane emission is anthropogenic. The anthropogenic methane emission is considerable and is estimated to approximately 380 million tonnes in 2020 (Global Methane Initiative) and the emission is rising year by year according to the same source. The global methane emission is equivalent to 9,4 billion tonnes CO2 equivalents (CO2E), approximately 16 % of the global greenhouse gas emissions measured in CO2E.
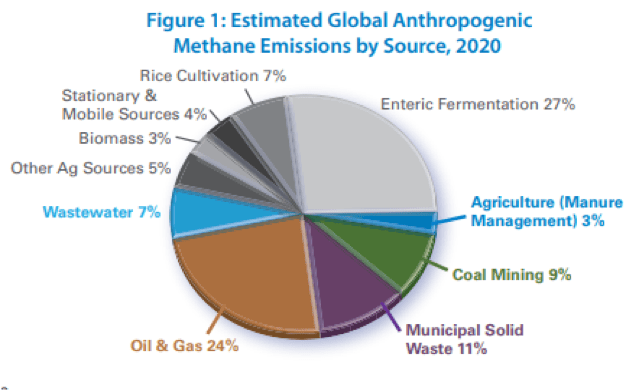
According to the Global Emission Initiative, Oil and gas exploration, production, transportation and distribution is responsible for 24% of the anthropogenic methane emissions as shown by Figure1. The uncertainties in these emission estimates are considered large, however.

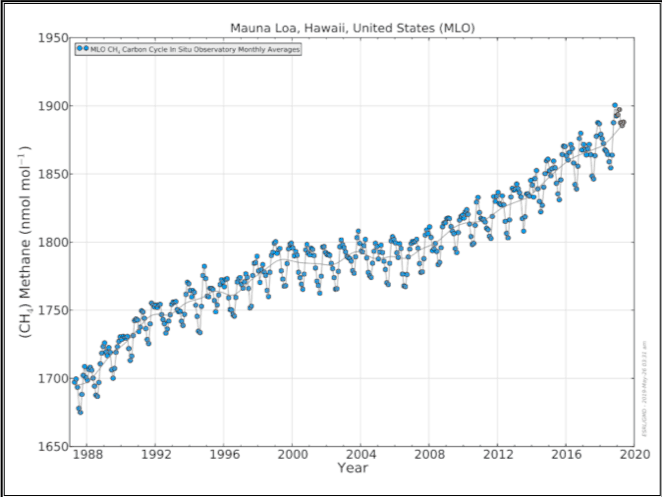
The accumulation of methane in the atmosphere is constantly rising according to measurements done at the Mauna Loa observatory. According to Global Emission Initiative, the methane emission and the concentration in the atmosphere is expected to increase in the coming decades.

Methane emission from the petroleum industry
Total natural gas production in 2018 was 4,0 x 10¹² Sm3 according to “Global Energy Statistic Yearbook 2019”. Assuming that 90% of the produced natural gas is methane with a density of 0,67 kg/Sm3, the total mass of produced methane is approximately 2,4 x 10⁹ tonnes.
As shown by Figure 1, the global oil and gas industry/activity is responsible for approximately ¼ of the anthropogenic methane emission inventory, estimated to 90 million tonnes. If the emission inventory estimates are correct, the methane emission represents approximately 3,8% of the total annual methane production by the oil and gas industry. This is a substantial amount that also represents a considerable monetary loss, estimated to 20 – 30 billion Euro annually, depending on the gas price.
It should be noted, though, that the reported inventories of methane emissions have a high degree of uncertainty, due to the huge difficulty in quantification of these emissions. This problem affects all emission sources, including oil and gas activity. The reason is that a large part of this emission is fugitive and not directly measurable.
The sources of the methane emission from the oil and gas industry is not clear. It is also unclear how the aggregated global emission inventory from this industry has been established. Historically, leakages in the domestic gas distribution systems have been reported as a major emission source. Old town gas systems were constructed by iron pipes joined together using putty. Leaks in the pipe connections were reported as a major source in the 1980’ies, but significant improvements have taken place over the last decades.
How methane emission is quantified
Methane emission is hard to quantify. The emission takes place from a variety of sources. The contribution from the predominant sources is not metered and cannot be directly measured. Various methods are used.
Some methods apply a bottom-up methodology, quantifying the emission from each identified source by means of an applicable method that may vary from source to source. The advantage of the bottom-up methodology is that the predominant emission sources can be identified, enabling efficient mitigation. A disadvantage is that some sourced may not be found and, in many cases, fugitive emissions will not be included.
The other approach is a top-down methodology. Several methods are used, most based on indirect measurement of methane concentration in the air (above and around a potential source, such as an industrial complex, a waste disposal site or a farming area), using satellites, air planes, drones or vehicles circling the area. Several techniques are applied, such as absorption in the infrared spectrum, etc. The advantage with the top-down methods is that all emission sources (known and unidentified) are covered, but the several problems exist:
- Measurement uncertainties.
- Conversion of methane concentrations to emission rates and inventories.
- Uncertain representativeness of the spot measurements related to annual emission inventories.
- Impacts from and interference with neighbouring emission sources.
- The predominant emission sources within the scanned area will not be identified, making it difficult to mitigate the emissions.
Methane emission from Norwegian oil and gas facilities
Traditional quantification methods
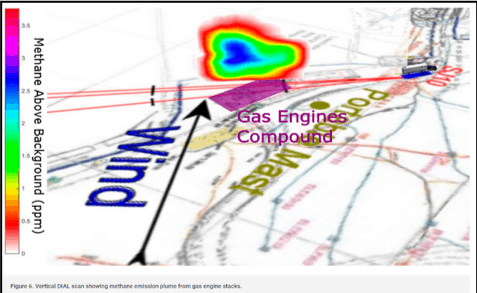
Most of the Norwegian onshore oil and gas terminals and refineries have traditionally applied a top-down methodology using a method called DIAL (Differential Absorption Lidar). This method is applicable on land-based plants, not offshore production facilities. The plant is divided into areas, such as gas intake, gas processing, storage facilities, harbour and offloading facilities, etc. The methane concentration above each of these areas is measured using a mobile scanning station (see Figure 3). The recorded methane concentration combined with wind measurements enables emission rates to be calculated.

One of the Norwegian oil refineries quantifies their methane emissions using a “bottom-up” method where the emission rates from identified sources are calculated based on known parameters.
The DIAL method is not applicable to the Norwegian offshore oil and gas production facilities, since the mobile unit, which is a large trailer, cannot be used. Since 1995, the methane emissions have been quantified using a bottom-up emission factor system, based on a dozen emission sources, each having its separate emission factor.
Updated quantification methods
NEMS AS has during the period from 2015 through 2018 been heavily involved in the establishment of improved methane emission quantification from Norwegian offshore and onshore oil and gas facilities. This work has primarily been funded by the Norwegian Environment Agency through several projects. NEMS AS has in addition been involved as advisors to Equinor in a substantial effort by the oil company to improve their methane emission inventory status and quantification methods from their three gas and oil terminals, their oil refinery and their methanol plant. Separate projects were conducted for Norwegian oil and gas to quantify emission of uncombusted hydrocarbons from from gas turbines and gas flaring on the offshore and onshore oil and gas facilities.
These projects have involved comprehensive reviews of each offshore and onshore oil and gas facility, terminal and refinery in Norway. A total of 68 offshore and 8 onshore facilities were screened. The work included mapping of all emission sources, regardless of their emission contribution and establishing quantification methodologies to each and every emission source. Almost 70 different types of emission sources were identified. Close to 50% of the emission sources contributed with insignificant emission inventories (aggregated less than 1 % of the estimated inventories). The emission from the predominant sources had a variety of characteristics:
- Some sources contributed with pure natural gas (methane plus Non Methane VOC).
- The emission from some sources can technically be fully mitigated, depending on cost.
- The emission from some sources has hardly potentials for mitigation at all.
- The emission from many sources contains inert gases mixed with smaller or larger amounts of methane. Such emissions may be hard to mitigate.
The aggregated methane emissions from the offshore oil and gas facilities were reported to 14 352 tonnes in 2018 using the new quantification method.
The updated quantification method applied on the Norwegian off- and onshore oil and gas activities is far more comprehensive and complete than the methods applied in other countries. Being a “bottom-up” methodology, some minor emission sources may have escaped below the radar, but it is very unlikely that the magnitude of such emission sources may dominate the emission inventory. The quantification methods are all tailor made to each emission source. Where accurate quantification is difficult, conservative methods are applied.
Fugitive emissions
All oil and gas facilities have fugitive emission of hydrocarbon gases. These emissions are minor leaks through flanges, stuffing boxes and threaded connections. Fugitive emissions cannot be avoided and are hard to measure. Each facility contains from several thousands up to more than 100 000 components (valves, etc) with leakage potentials. Most leaks are extremely small and cannot be detected or measured. Some leakages are detectable, however, and the high number of components can make the aggregated fugitive emission a significant source. The leakage consists of natural gas with methane being the predominant component (normally in the range of 50 to 90 weight %).
A method called “bagging” can be used to measure the leak rate. Each component is isolated by means of a specially designed “bag” and the leak rate is measured. A technology called “high flow sampling” is the predominant bagging technology. “Bagging” of all components on an oil and gas handling facility is a tremendous job, not practically feasible. The US EPA (Environmental Protection Agency) has developed a methodology called “Method 21” based on methane sniffing and statistics. The method is described in “Protocol for Equipment Leak Emission Estimates), issued by EPA in 1995. This method, which form the basis for the European standard EN-15446 (2008); is however also quite labour intensive.
A new methodology for quantifying fugitive emissions based on the same principles is the OGI (Optical Gas Imaging) leak/no leak method. A handheld IR-camera is used to scan all hydrocarbon containing components. Leaks above a certain threshold (depending on the camera resolution) are detected and the aggregated fugitive emission is calculated by means of emission factors determined based on statistical data and Monte Carlo simulations. One factor per leak is established for components with detected leaks and another and much smaller emission factor per component is used for all components with no leak detected. The advantages of the “OGI leak/no leak” method compared to “Method 21” and the referenced standard are:
- The IR-scanning of components is far faster than the sniffing.
- All components can be covered without scaffolding work.
During 2017, 50 offshore oil and gas facilities on 31 producing fields were scanned for fugitive leakages. In 2018 eight onshore onshore facilities were scanned in a similar way (4 oil and gas terminals, two refineries, one LNG base load plant and one methanol plant). Leaks were detected from a total of 2320 components (these plants and facilities contained more than a million components). Based on the results, the aggregated annual methane emission inventory from all off- and onshore facilities were calculated to around 1100 tonnes using the “OGI leak/no leak method”. In order to check the correctness of this method, 28% of the leak rates from 256 components on the onshore plants were measured using the “High Flow Sampling” method. The measurements showed that the real emission was much lower than the emission calculated by the OGI method (70 % lower), indicating that the “OGI leak/no leak” method is highly conservative.
International work
Two international initiatives are working actively to map and mitigate methane emission:
The Global Methane Initiative (GMI)is an international public-private partnership focused on reducing barriers to the recovery and use of methane as a clean energy source. GMI’s 45 Partner Countries and more than 500 Project Network members exchange information and technical resources to advance methane mitigation in three key sectors: Oil and gas, Biogas and Coal mines.
The Climate and Clean Air Coalition (CCAC)is a voluntary partnership of governments, intergovernmental organizations, businesses, scientific institutions and civil society organizations committed to protecting the climate and improving air quality through actions to reduce short-lived climate pollutants. The CCAC global network currently includes over 100 state and non-state partners, and hundreds of local actors carrying out activities across economic sectors.
Both organizations have addressed the oil and gas industry as a major focus area.
Norway is a member country in both organizations.
Main picture: "Bubbles of methane on the black ice of Lake Baikal" © Anna /Adobe Stock
